Non-Grid Interpolation Package
This package provides interpolation functions of 3D data which is non-grid in domain.
Preparation
Set this notebook directory to current:
![]()
Load the package:
![]()
Function of the package:
![]()
![]()
Data
Objective data (3D):
![]()
Visualization by ListDensityPlot:
![]()
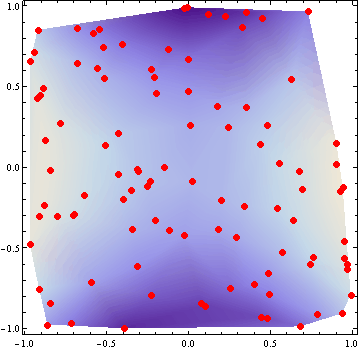
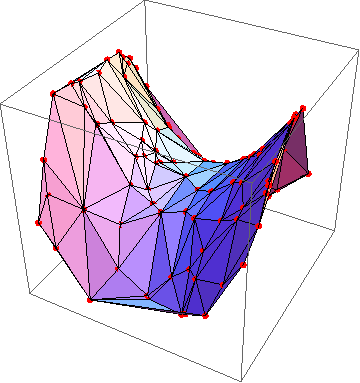
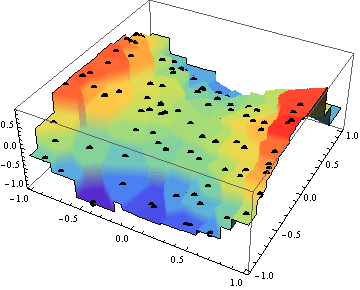
Visualization by TriangularSurfacePlot (the package loads Computational Geometry Package):

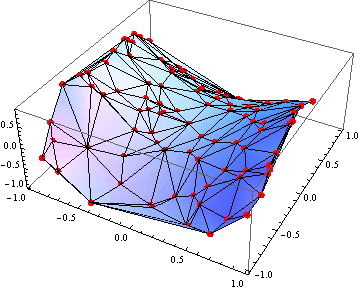
Visualization by ListPlot3D:

NearestNeighbor
Basic
Get usage information:
![]()
Get interpolation function by Nearest Neighbor:
![]()
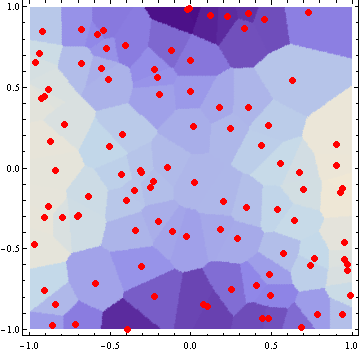
Visualization by DensityPlot:
![]()
Visualization by Plot3D:

Boundary
Data 2:
![]()
Get interpolation function by Nearest Neighbor:
![]()
Visualization by DensityPlot:
![]()
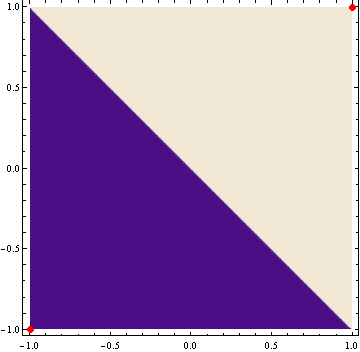
Visualization by Plot3D:

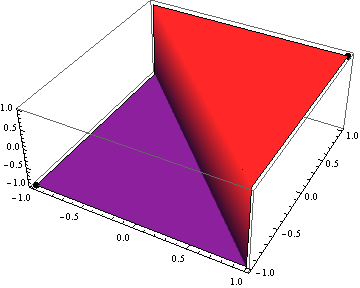
By default, use boundary process function Mean:
![]()
![]()
Boundary process function is arbitrary.
If boundary process function evaluates NearestFunction, use Hold and ReleaseHold.
Use boundary process function Max:
![]()
![]()
Use boundary process function Min:
![]()
![]()
![]()
![]()
![]()
![]()
![]()
![]()
DelaunayTriangulationPiecewiseLinear
Basic
Get usage information:
![]()
Get interpolation function by Delaunay Triangulation Piecewise Linear:
![]()
Visualization by DensityPlot:
![]()
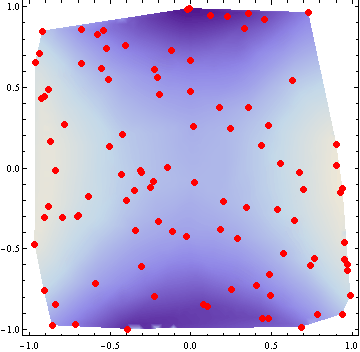
Visualization by Plot3D:

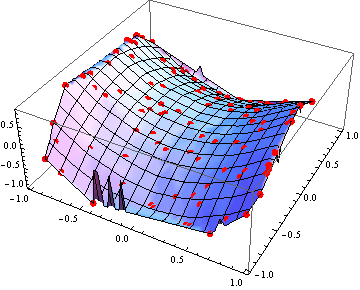
Extrapolation
By default, use extrapolation value Indeterminate:

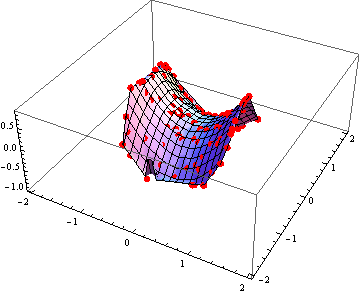
Extrapolation value or function is arbitrary.
Get interpolation function by Delaunay Triangulation Piecewise Linear using extrapolation value 0:
![]()
Visualization by Plot3D:

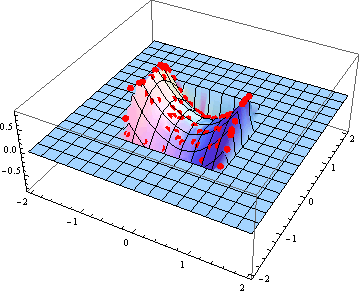
Get interpolation function by Delaunay Triangulation Piecewise Linear using extrapolation function #1^2 + #2^2 (except &):
![]()
Visualization by Plot3D:

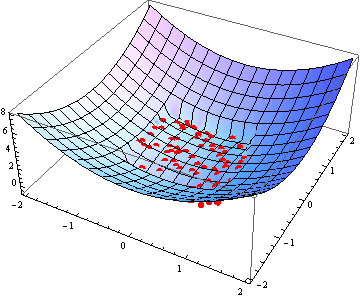
Compile
Be quickly by compile.
Get interpolation function by Delaunay Triangulation Piecewise Linear using extrapolation value 0:
![]()
Timing to visualization:

Get compiled function:
![]()
Timing to visualization:

RadialBasisFunctionNetwork
Basic
Get usage information:
![]()
Get interpolation function by Radial Basis Function Network:
![]()
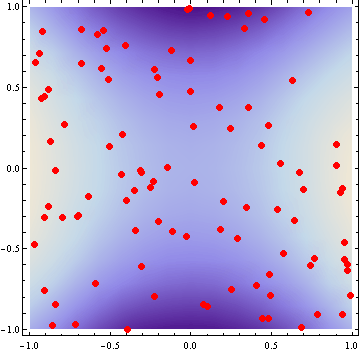
Visualization by DensityPlot:
![]()
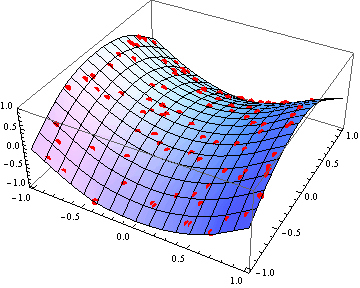
Visualization by Plot3D:

Radial Basis Function
By default, use radial basis function Thin Plate Spline (If[#==0,0,#^2Log[#]]&):
![]()
![]()
Radial basis function is arbitrary.
Get interpolation function by Radial Basis Function Network using radial basis function #&:
![]()
Visualization by Plot3D:

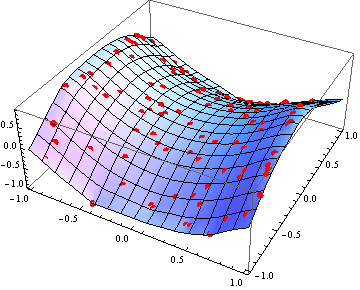
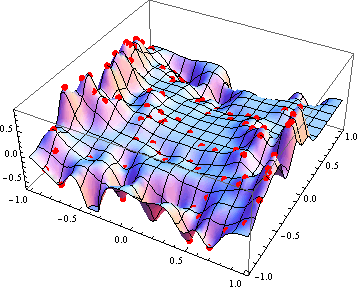
Get interpolation function by Radial Basis Function Network using radial basis function Exp[-(#/(1/10))^2]&:
![]()
Visualization by Plot3D:

Compile
Be quickly by compile.
Get interpolation function by Radial Basis Function Network:
![]()
Timing to visualization:

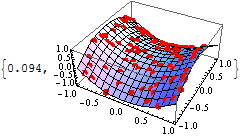
Get compiled function:
![]()
Timing to visualization:

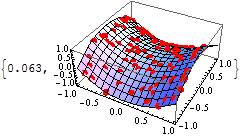
ProcessDuplication
Basic
Get usage information:
![]()
Data 3:
![]()
Get data processed duplication:
![]()
![]()
Process Function
By default, use process function Mean:
![]()
![]()
Process function is arbitrary.
Use process function Max:
![]()
![]()
Use process function Min:
![]()
![]()
Data 4:
![]()
Visualization by ListDensityPlot:
![]()
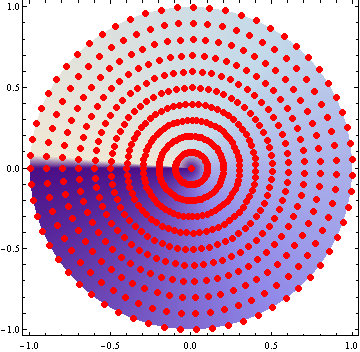
Visualization by ListPlot3D:

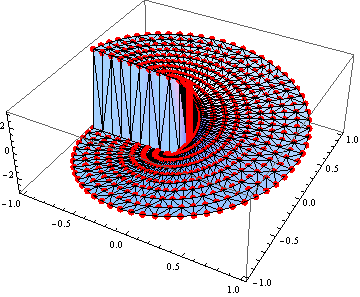
Be failed if get interpolation function of data existing duplication point:
![]()
![]()
![]()
Get data processed duplication:
![]()
Get interpolation function of data processed duplication:
![]()
Visualization by Plot3D:

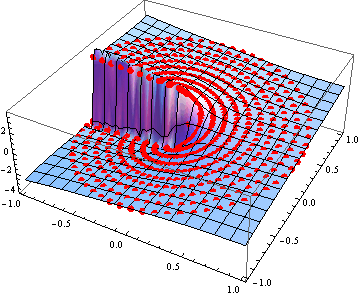
Get data processed duplication using process function Max:
![]()
Get interpolation function of data processed duplication:
![]()
Visualization by Plot3D:

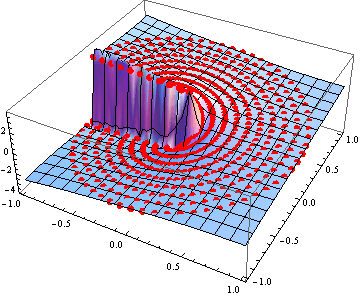
Get data processed duplication using process function Min:
![]()
Get interpolation function of data processed duplication:
![]()
Visualization by Plot3D:

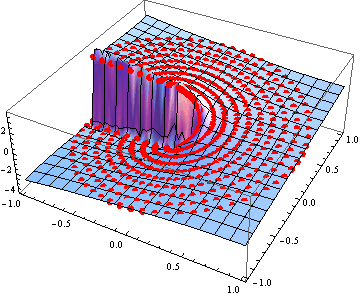
ConvexHullQ
Basic
Get usage information:
![]()
Projection to domain (2D) of objective data (3D):
![]()
Get region function of convex hull:
![]()
Visualization by RegionPlot:
![]()
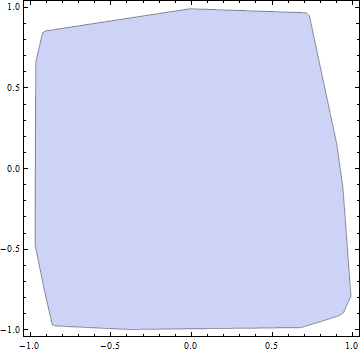
ConvexHullArea
Basic
Get usage information:
![]()
Get convex hull area:
![]()
凸包面積とそのデータ発生領域面積に対する割合:
Convex hull area and its ratio to data generation region area:
![]()
![]()